Please wait...1Level Playing Field Rankings
‘amLeague is an online storefront based on Institutional Investors criteria. Very different than a funds classification’ – an Institutional Investor
- Active sponsoring from a Club of Institutional Investors: mandate guidelines’ definition
- Portfolio managers demonstrate their management capabilities in a 100% transparent and 100% comparable way
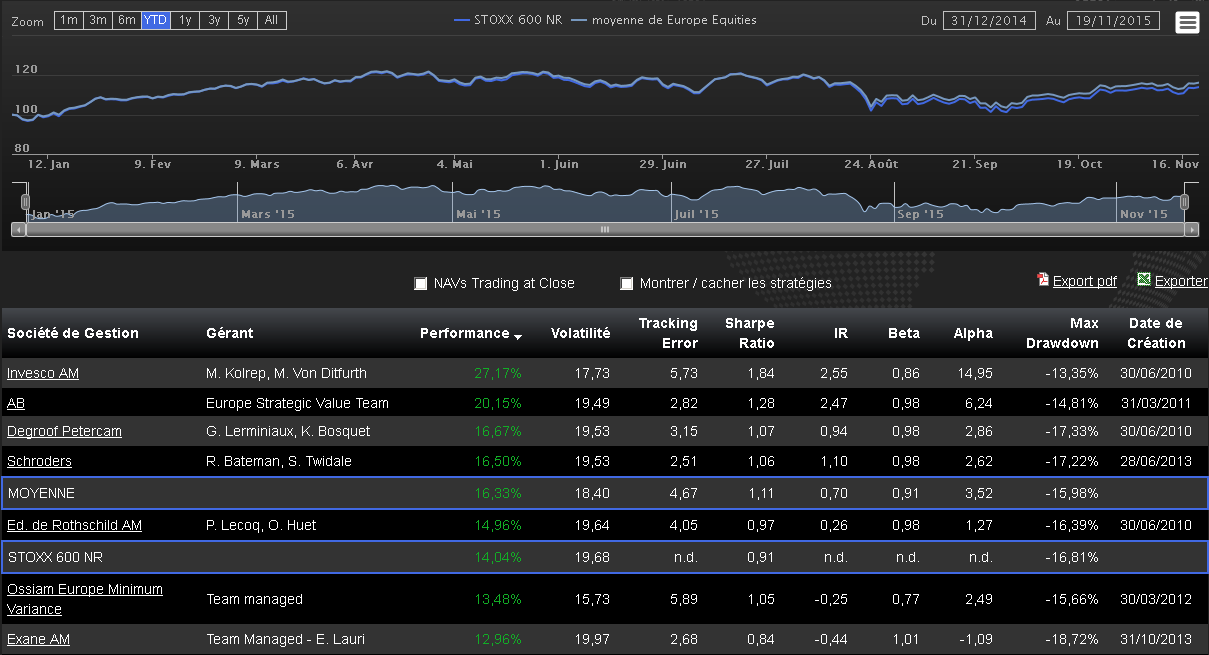
- amLeague publishes performance tables per mandate: Euro Equities, Europe SRI Equities, Global Equities, Multi Asset Class,etc.
2Strategies and Indices
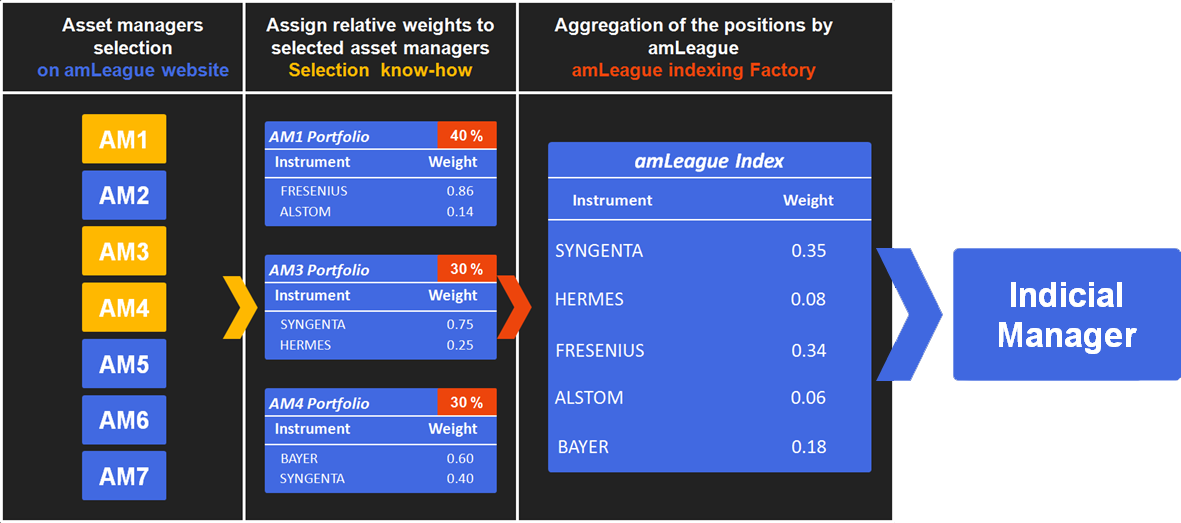
‘Our indicial fund replicates an amLeague Index: easy, transparent and an exhaustive information’ – an Institutional Investor
amLeague is an Active Management Index Provider: from the data and research produced amLeague builts up either public or customised indices that can easily be replicated by an indicial manager.
- Public indices: created and monitored by amLeague, based on purely quantitative criteria
- Customised indices: designed by an investor (Institutionals, Multimanagers, IFAs, ...) on its customised criteria and monitored by amLeague
Test your abilities
I am a portfolio manager
I would like to participate to amLeague RANKINGS
Register my Freemium portfolioI am an investor
I would like to test my allocation abilities with amLeague INDEXING
Create my strategyRankings
YTD performance rankings as of 06/23/2026
Euro Equities
| Asset Management Company | YTD | Volatility | IR | Alpha | Max Drawdown | Inception date |
|---|---|---|---|---|---|---|
| Degroof Petercam | 15.19% | 17.41 | 0.21 | 1.19 | -35.55% | 03/31/2011 |
| Invesco AM | 14.33% | 18.90 | 0.08 | 0.14 | -40.80% | 06/30/2010 |
| Seven European Equity Fund | 14.01% | 15.52 | 0.08 | 2.40 | -32.86% | 12/08/2015 |
| GIP EURO EQUITY | 13.53% | 18.57 | -0.82 | -1.56 | -37.69% | 12/31/2019 |
| SANSO IS | 13.35% | 16.81 | 0.18 | 1.40 | -37.46% | 11/14/2016 |
| EUROSTOXX NR | 10.42% | 18.08 | n.a. | n.a. | -37.89% |
Europe Equities
| Asset Management Company | YTD | Volatility | IR | Alpha | Max Drawdown | Inception date |
|---|---|---|---|---|---|---|
| Bright Cap Momentum Comfort | 15.95% | 19.83 | 0.23 | 2.06 | -40.50% | 11/29/2017 |
| Alphajet Fair Investors | 11.81% | 16.20 | 0.02 | -0.93 | -33.66% | 10/30/2020 |
| La Française Digital Trends | 11.76% | 15.63 | -0.10 | 0.11 | -31.49% | 12/29/2017 |
| BNPPAM BNP PARIBAS GROUP | 11.44% | 15.82 | 0.05 | 0.33 | -38.36% | 06/29/2012 |
| Degroof Petercam | 10.18% | 16.04 | 0.07 | 0.34 | -33.93% | 06/30/2010 |
| STOXX 600 NR | 9.06% | 15.96 | n.a. | n.a. | -35.36% |
Global Equities
| Asset Management Company | YTD | Volatility | IR | Alpha | Max Drawdown | Inception date |
|---|---|---|---|---|---|---|
| Degroof Petercam | 30.16% | 13.01 | -0.23 | 1.03 | -31.31% | 12/30/2011 |
| Alphajet Fair Investors | 25.51% | 16.30 | 0.73 | 4.10 | -24.29% | 11/02/2020 |
| HCP Long Free Cash Flow | 17.64% | 19.00 | 1.07 | 5.10 | -30.03% | 06/17/2016 |
| SANSO IS | 12.79% | 15.66 | 0.27 | 1.14 | -30.62% | 11/30/2015 |
| Iris Avenir | 11.80% | 13.85 | -0.48 | -0.44 | -32.55% | 11/24/2017 |
| STOXX 1800 NR | 11.73% | 14.28 | n.a. | n.a. | -33.53% |
Global Low Carbon
| Asset Management Company | YTD | Volatility | IR | Alpha | Max Drawdown | Inception date |
|---|---|---|---|---|---|---|
| Amundi Asset Management | 29.28% | 14.86 | 0.30 | 3.57 | -33.44% | 12/15/2015 |
| Arkea Asset Management | 23.66% | 16.61 | 0.02 | 1.03 | -31.80% | 12/15/2015 |
| Roche-Brune Global Low Carbon | 20.56% | 15.59 | 0.11 | 0.74 | -33.14% | 12/15/2015 |
| La Française Inflection Point Global Low Carbon | 14.60% | 16.72 | 0.46 | 0.74 | -29.88% | 12/15/2015 |
| BNPPAM Index Decarb50 | 12.52% | 14.93 | 0.25 | 0.52 | -33.48% | 12/15/2015 |
| MSCI WORLD in EUR | 11.46% | 15.18 | n.a. | n.a. | -33.76% |
All Global
| Asset Management Company | YTD | Volatility | IR | Alpha | Max Drawdown | Inception date |
|---|---|---|---|---|---|---|
| MSCI WORLD in EUR | 11.46% | 15.18 | n.a. | n.a. | -33.76% |
Create your Freemium Portfolio
An easy way to compare your portfolio to your peers
(guide)
Indices
Index value as of 06/23/2026
| Index | Mandate | Value | YTD | Since inception | Volatility | Inception date |
|---|---|---|---|---|---|---|
| AGI_Euro50_IESG | Euro Equities 50 | 270.15 | 12.33% | 170.15% | 17.28 | 10/05/2017 |
| amLeague EURO50 | Euro Equities 50 | 585.68 | 12.46% | 485.68% | 17.79 | 03/31/2011 |
| amLeague EURO50 ESG | Euro Equities 50 | 196.82 | 12.86% | 96.82% | 16.02 | 10/05/2023 |
| amLeague EURO50 LFI | Euro Equities 50 | 551.49 | 12.28% | 451.49% | 17.79 | 03/31/2011 |
| amLeague EURO50 LFI ESG | Euro Equities 50 | 194.97 | 12.68% | 94.97% | 16.03 | 10/05/2023 |
| amLeague_Euro 45 © | Euro Equities 50 | 375.75 | 13.56% | 275.75% | 17.81 | 10/05/2010 |
| EURO STOXX 50 NR | 369.91 | 9.36% | 269.91% | 19.38 | ||
| amLeague_Europe 75 © | Europe Equities | 431.30 | 9.73% | 331.30% | 15.16 | 07/05/2012 |
| amLeague_Low Beta Europe © LB90 | Europe Equities | 279.35 | 1.95% | 179.35% | 12.63 | 01/07/2013 |
| STOXX 600 NR | 401.18 | 9.06% | 301.18% | 15.96 |
Build your own strategy
An easy way to test your allocation abilities
Start now to select your preferred asset managers
